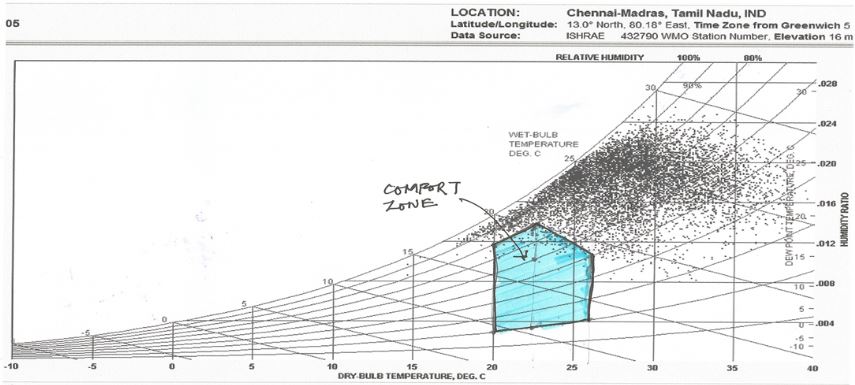
Thermal Comfort Zone Representation
Subject
Climatology
,Academic Year
2'nd Year
,Complexity Level
Beginner
,Content tags
Architectural Design
,Space Cooling
,Thermal comfort
,Activity Type
Demonstration
,Activity duration
< 1 hour
,Objective
To come up with a range of thermal comfort conditions for your city and identify with one’s own thermal comfort range.
Outcome
Students will understand that thermal comfort is not a fixed entity. It’s range can be varied by enabling thoughtful cooling techniques.
Requirements
Printouts of city specific psychrometric charts for all the students. To be downloaded from: http://www.fairconditioning.org/resources/#149-other-resources-1476600454
Prerequisites
- A conceptual knowledge of thermal comfort & psychrometry.
- An understanding of psychrometric chart.
Procedure
Step 1: Take printouts of psychrometric charts of your city for all students and let each carry one chart with yourself.
Step 2: Plot different conditions and temperature on the chart, by changing their locations. Each student should carry out this activity or ideally few to demonstrate the difference of thermal comfort experiences:
Conduct the observations in different points such as:
- Under the sun, peak time
- Peak summer time under the tree
- Under a semi-covered structure
- Beachside, if there is around
- On the road, around highly built environment
- In the park, around few trees
- In a courtyard inside a building
- Inside the room with decent ventilation, poor ventilation and no ventilation
And such different locations and observe two following things:
- How do you feel in this location, rate in the level of comfort, On a scale of 1-10 (1 being highly uncomfortable and 10 being highly comfortable)
- Plot both Dry Bulb Temperature and Relative Humidity on the psychrometry chart.
Step 3: Identify your own comfortable zone and uncomfortable zone by joining the dots on the psychrometric chart. For eg. If your comfort zone is near to the scientific standards i.e. 98.6°F (37°C), students will be able to experientially identify with that temperature.
Step 4: Share the findings and zones with others, see if there is diversity.
Step 5: Compare the comfort zone with the weather data.
Step 6: Reflect on following points:
- What makes the Thermal comfort dynamic and non-static? How much difference is it for different people in the same city, zone?
- Are our buildings designed according to any thermal comfort range or standards? What are those and how appropriate are those?
Image
References
Fairconditioning’s thermal Comfort and Indoor Air Quality presentation