Urban Heat Island Effect
Subject
Alternative Building Technology & Materials
,Urban Design
,Urban Planning
,Academic Year
4'th Year
,Complexity Level
Advanced
,Content tags
Climate Change
,Climate Justice
,Urban Development
,Activity Type
Demonstration
,Simulation Software
,Activity duration
1 day
,1-2 hours
,Objective
- To understand the Urban Heat Island effect of concrete (paved) surfaces
- Identify local heat islands
- See how different land cover affects temperature
- Interpret earth observation derived temperature maps
- Understand how urban-scale weather/climate information may be usefully employed at urban management
Outcome
Students understand the impact of using concrete heavily in the built environment and be able to visualise its impact. (use as a prompt to realise and encourage the use of other environment friendly materials for construction)
Requirements
Laptop, Heatmapper, Recent Datasets
Prerequisites
Basic knowledge on RCC, Urban design, QGIS software trained Faculty
Procedure
Step 1: This activity can be done in two variations:
- visit the selected locations and experience it, followed by analysis and simulation activity
- Select the locations and start with the analysis and simulation activity without the visit
Step 2: Select three diverse locations
- One urban park,
- densely built area with buildings of concrete, glass, additionally without any soft cover ,
- Eco-material building such as mud or exposed brick
Step 3: Compare all three locations. Map each and take notes, Understand what exists in the locality in-depth (heterogeneous materials, duration of heating. Water bodies, trees or greens)
Table:
| Location 1: Park Description/Observations: | Location 2: Densely built area Description/Observations: | Location 3: Eco-materials building (mud, exposed brick) Description/Observations: |
Area of Concrete/other materials: Area of Greenery: Hard/soft landscape ratio: Land Surface Temp.: Additional notes: | Area of Concrete/other materials: Area of Greenery: Hard/soft landscape ratio: Land Surface Temp.: Additional notes: | Area of Concrete/other materials: Area of Greenery: Hard/soft landscape ratio: Land Surface Temp.: Additional notes: |
Step 4: Compare Notes and draw inferences.
Notes for the Facilitator on how to prepare for the class
- Assemble satellite images of the same location across different time periods.
- Analyse them through QGIS (either the facilitator shows or if the students are aware of GIS they can do this on their own systems)
- Compare the increase in built up area and the temperature maps to understand the relation between the two
References Image
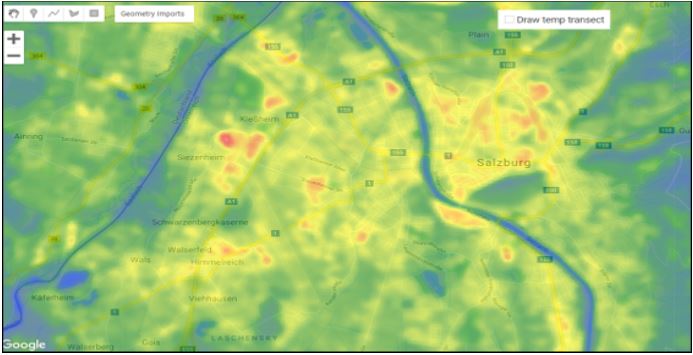
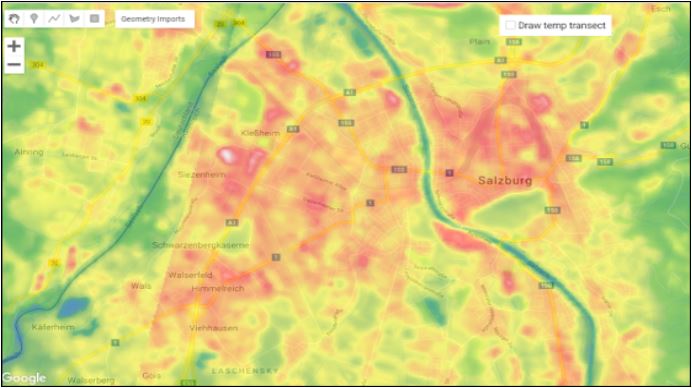
The analysis shows the impact of different land cover on land surface temperature. It would be imperative to identify Urban heat islands within the city.